Case 15: Thickness Distribution on Lift-off Wafers
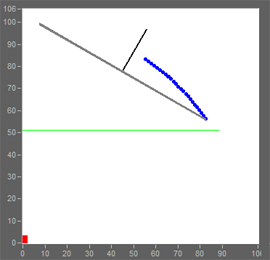
In this example we examine the coating of flat wafers in the lift-off coater that we modeled in the previous case.
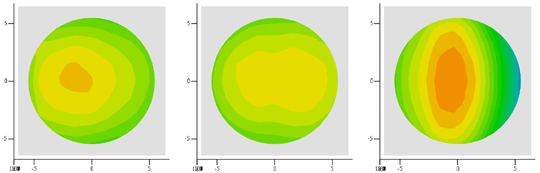
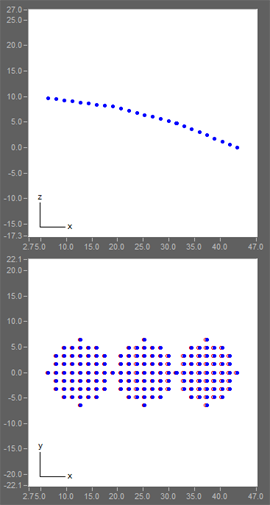
We place three 5-inch wafers on the inside of the spherical carrier as shown in the chamber view and fixture views below. For each wafer we compute for 49 points on an X-Y grid. The computed thickness values are used for the contour plots below.
With the presence of the masks, the thickness nonuniformity values for the three wafers are 0.36%, 0.31% and 1.3%, respectively. In the Y-direction, the coating is slightly thicker in the middle for all wafers due to the flatness of the wafers.
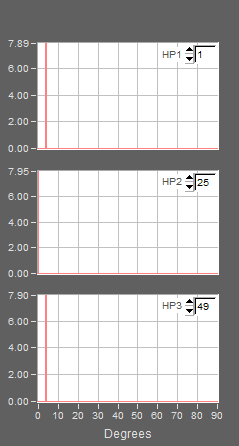
Incident angle statistics on any of the computed surface points can be viewed in the result datum file, and in the histograms displayed. The following histograms are associated with three points on the first wafer: the top and the bottom graphs are for two points on the edge of the wafer while the middle graph is for the center point. The vapor strikes the center point perfectly normally and the edge points with a fixed incident angle of approximately 5 degrees.